
Roofing Marketing KPIs for Contractors: Track $35–$75 CPL Weekly
Track seven core numbers: cost per lead, website conversion rate, customer acquisition cost, customer lifetime value, return on ad spend, lead-to-job conversion, and review conversion. The single highest-priority move this month is setting up weekly cost-per-lead and lead-to-job tracking, since vanity metrics like clicks hide the funnel problems that actually sink campaigns.
TL;DR:
- Roofing leads typically cost $35 to $75, and acquisition costs run $250 to $750; aim for customer lifetime value at least three times acquisition cost.
- Roofing websites typically convert 2% to 3% of visitors, while 15% to 30% of leads become jobs; compare channels by completed work, not inquiries.
- Use unique landing pages, tagged links, and phone numbers per campaign, then log calls and forms in a CRM using one written qualified lead definition.
- Separate storm period results from routine campaigns, because lead costs often rise after severe weather and blended averages can misrepresent both periods.
Table of Contents
- 1. Key roofing marketing KPIs and their benchmarks
- 2. How to track these numbers accurately
- 3. Building a dashboard you’ll actually check weekly
- 4. Operational fixes that raise close rates and lower CAC
- 5. Integrating KPIs with storm-response marketing
- 6. KPIs specific to storm-driven customer acquisition
- 7. Adjusting KPIs as storm severity and timing shift
- Prioritizing KPIs without drowning in dashboards
- A managed storm-response system built around these numbers
- FAQ
- Sources
1. Key roofing marketing KPIs and their benchmarks
Each of these numbers tells you something different about your funnel, and none of them means much in isolation. Here is what to calculate, what roofing-specific range to expect, and how often to look at it.
Cost per lead (CPL) is total marketing spend divided by qualified leads generated. Roofing contractors typically see $35 to $75 per qualified lead, though storm markets with heavy competition can push this higher. Review CPL weekly, broken out by channel, so a spike doesn’t go unnoticed for a month.
Website conversion rate is the share of visitors who complete a meaningful action, a form fill or a call, divided by total visitors. Most roofing sites convert around 2% to 3%, with a reasonable target of 3% to 7% and top performers clearing 10%. Check this one every two weeks since traffic volume needs time to produce a stable rate.
Customer acquisition cost (CAC) divides total marketing spend by the number of customers actually acquired, not just leads. Roofing CAC typically runs $250 to $750, with commercial roofing jobs landing at the higher end because sales cycles run longer and involve more touchpoints. CAC only means something next to lifetime value, so pair the two.
Customer lifetime value (CLV) estimates the total revenue a customer generates across repairs, replacements, and referrals over time. A simplified approach for roofing is average job value multiplied by expected repeat and referral jobs over a multi-year window. The target is a CLV at least three times CAC; below that ratio, your acquisition spend is eating your margin.
Return on ad spend (ROAS) divides revenue generated from ads by the amount spent on those ads. A healthy range for roofing campaigns is 3:1 to 5:1, meaning $3 to $5 in revenue for every dollar spent. Review this weekly per campaign, since underperforming ad sets need to be paused or reallocated fast, not discovered at month end.
Lead-to-job conversion rate is the share of leads that actually book and complete a job. Roofing benchmarks sit at 15% to 30%, and this is the number that tells you whether a channel delivers real buyers or just inquiries. Use it to qualify channels against each other, not just against a flat target.

Review conversion rate divides the number of reviews collected by the number of completed jobs. A target of 10% to 15% keeps your review volume growing fast enough to matter for local search visibility and for the trust signals homeowners look for before they call.
A few quick-reference points worth keeping on a sticky note:
- CPL and ROAS move fast, so review them weekly by channel.
- Conversion rates need a two-week window to stabilize before you act on them.
- CAC and lead-to-job rate are monthly checks; CLV is a quarterly one.
2. How to track these numbers accurately
Clean KPI data depends entirely on how you set up attribution before the leads start flowing, not after. Get this wrong and every number above becomes a guess dressed up as a metric.
- Build a unique landing page and UTM tag combination for every campaign and channel, so traffic sources never blur together in your reporting.
- Assign source-specific phone numbers or use a call tracking provider so every inbound call ties back to the exact ad, keyword, or channel that generated it.
- Record call duration and outcome for each tracked number, since a brief hang-up and a qualifying conversation are not the same lead.
- Feed both calls and form submissions into your CRM with required fields for service area, project type, budget range, and stated intent.
- Define “qualified lead” once, in writing, and apply that definition consistently across every channel and every team member logging leads, using lead stages to prevent the same contact from being counted twice.
A workable tool stack for most roofing companies is a call tracking provider paired with Google Analytics or GA4, a CRM that supports custom fields, and, where applicable, Local Service Ads tracking for Google’s own lead product. Click-to-call matters more than most contractors assume: adding a phone number to a mobile search ad can lift click-through rate by roughly 8%, and those calls should be logged as conversions with an estimated value tied to your average job size.
Follow-up automation closes the loop between a tracked lead and a tracked job. A system like Otto’s client follow-up framework can handle the reminder sequences and scheduling nudges that keep a lead from going cold between the first call and the signed contract, which matters just as much for your conversion numbers as the tracking setup itself.
Pro Tip: Audit your UTM tags monthly. A single mislabeled campaign link can quietly corrupt a channel’s CPL for weeks before anyone notices the number looks wrong.
3. Building a dashboard you’ll actually check weekly
A dashboard nobody opens is worse than no dashboard, since it creates a false sense of visibility. A practical structure uses five layers: media spend and CPL by channel, call handling performance, funnel conversion stages from lead to appointment to install, job economics including any insurance supplement capture, and a weather or seasonality overlay that tells you whether a dip is a funnel problem or just a slow storm season.
Match what you review to how fast each number moves.
- Weekly: CPL by channel, ROAS by campaign, call volume, and speed-to-lead.
- Monthly: CAC, lead-to-job conversion rate, revenue attribution by channel, and review conversion rate.
- Quarterly: CLV, long-term ROAS trends, retention and referral patterns, and decisions about reallocating budget across channels.
This cadence keeps your weekly check focused on things you can fix immediately, like a channel whose CPL jumped overnight, while saving the slower-moving numbers like CLV for a quarterly strategy session where a single data point wouldn’t tell you much anyway.
4. Operational fixes that raise close rates and lower CAC
Tracking the numbers is only half the job. The other half is acting on what speed-to-lead and qualification data tell you before the lead goes cold.
- Respond to new leads within minutes, not hours. Thirty-nine percent of homeowners expect same-day contact, and contact within the first five minutes meaningfully raises the odds of booking an appointment.
- Standardize your first-contact script to capture service area, roof type, budget range, and whether insurance or storm damage is involved, every time, regardless of who answers the phone.
- Build a follow-up workflow with an immediate automated acknowledgment, a prompt live call attempt, a reminder sequence for unresponsive leads, and a confirmation step before every appointment.
- Measure close rate by source monthly and shift budget toward channels producing a higher lead-to-job conversion rate, even if their raw CPL runs a bit higher.
A one-to-two-day response window is not competitive. Responding within five minutes significantly improves conversion odds compared to next-day follow-up, which is often too late once a homeowner has already called a competitor.
5. Integrating KPIs with storm-response marketing
Storm-response marketing runs on a different clock than everyday roofing campaigns, and your KPI tracking needs to flex with it. In the days right after a hailstorm or major wind event, CPL often spikes as every roofing company in the region floods the same search terms and service areas simultaneously. That spike is not a sign of a broken campaign. It’s the cost of competing in a compressed, high-demand window.
The fix is to treat storm windows as their own reporting segment rather than blending them into your monthly averages. Compare storm-period CPL and lead-to-job conversion against storm-period benchmarks, and compare blue-sky-day performance against its own baseline. Mixing the two makes both numbers misleading.
Speed-to-lead becomes even more critical during storm response, since multiple contractors are calling the same homeowner within hours of each other. Your call handling layer and response-time tracking should get extra attention in the first 48 to 72 hours after a storm event, because that window often determines which contractor gets the job regardless of who ran the better ad.
6. KPIs specific to storm-driven customer acquisition
A few numbers matter more during storm response than they do in routine marketing, because storm leads behave differently from everyday inquiries. Track lead volume per storm event against your team’s capacity to respond, since a flood of leads your crews can’t follow up on fast enough produces a worse lead-to-job rate than a smaller, well-handled batch.
Insurance involvement rate deserves its own line item. Storm leads frequently include an insurance claim component, which extends the sales cycle and changes what “qualified” means for that lead. Track the share of storm leads with active insurance claims separately from cash-pay leads, since their close rates and timelines rarely match.
Verification rate matters too: the percentage of storm leads confirmed as homeowners with actual, verifiable damage versus general inquiries. A storm-response system built around verified damage, rather than raw call volume, tends to produce a stronger lead-to-job conversion number even when CPL runs higher during peak demand periods.
7. Adjusting KPIs as storm severity and timing shift
Not every storm produces the same demand curve, so your KPI targets shouldn’t stay fixed across every event. A widespread hail event covering several counties generates a longer tail of demand than a narrow, localized wind event, and your CPL and speed-to-lead targets should flex accordingly.
Immediately after a severe storm, expect CPL to run above your normal benchmark and treat that as acceptable given the compressed competitive window. As the event ages past a week or two, demand tapers and CPL should drift back toward your baseline range. If it doesn’t, that’s a signal your campaign hasn’t adjusted its targeting or budget pacing to the slower phase.
Response timing benchmarks should tighten, not loosen, during severe events. When multiple contractors are chasing the same leads, a same-day response target isn’t aggressive enough. Shifting your internal goal to prompt contact immediately after a major storm, then easing back to a standard same-day target as the event cools, keeps your lead-to-job rate from eroding during the window when competition is fiercest.

Prioritizing KPIs without drowning in dashboards
If you track nothing else, track cost per lead and lead-to-job conversion rate. Those two numbers alone tell you whether marketing is working and whether sales is closing what marketing delivers. Everything else is refinement.
When you work with any outside marketing partner, ask three questions every month: what exact spend produced this month’s leads, what the cost per lead was and how it trended, and what specific change they’re making next month based on that trend. A partner who can’t answer plainly is handing you activity reports, not performance data.
None of this works if sales, operations, and marketing are measuring success differently. Align everyone around the same lead-to-job number before arguing about channel budgets.
— Angel
A managed storm-response system built around these numbers
Setting up clean attribution, call tracking, and CRM integration from scratch takes real time, time most roofing teams would rather spend on roofs. Our storm-response system handles that setup directly: we deliver human-verified, exclusive leads tied to actual storm demand, route them into your CRM, and report the same CPL and lead-to-job numbers this article walks through, without a long-term contract locking you in.
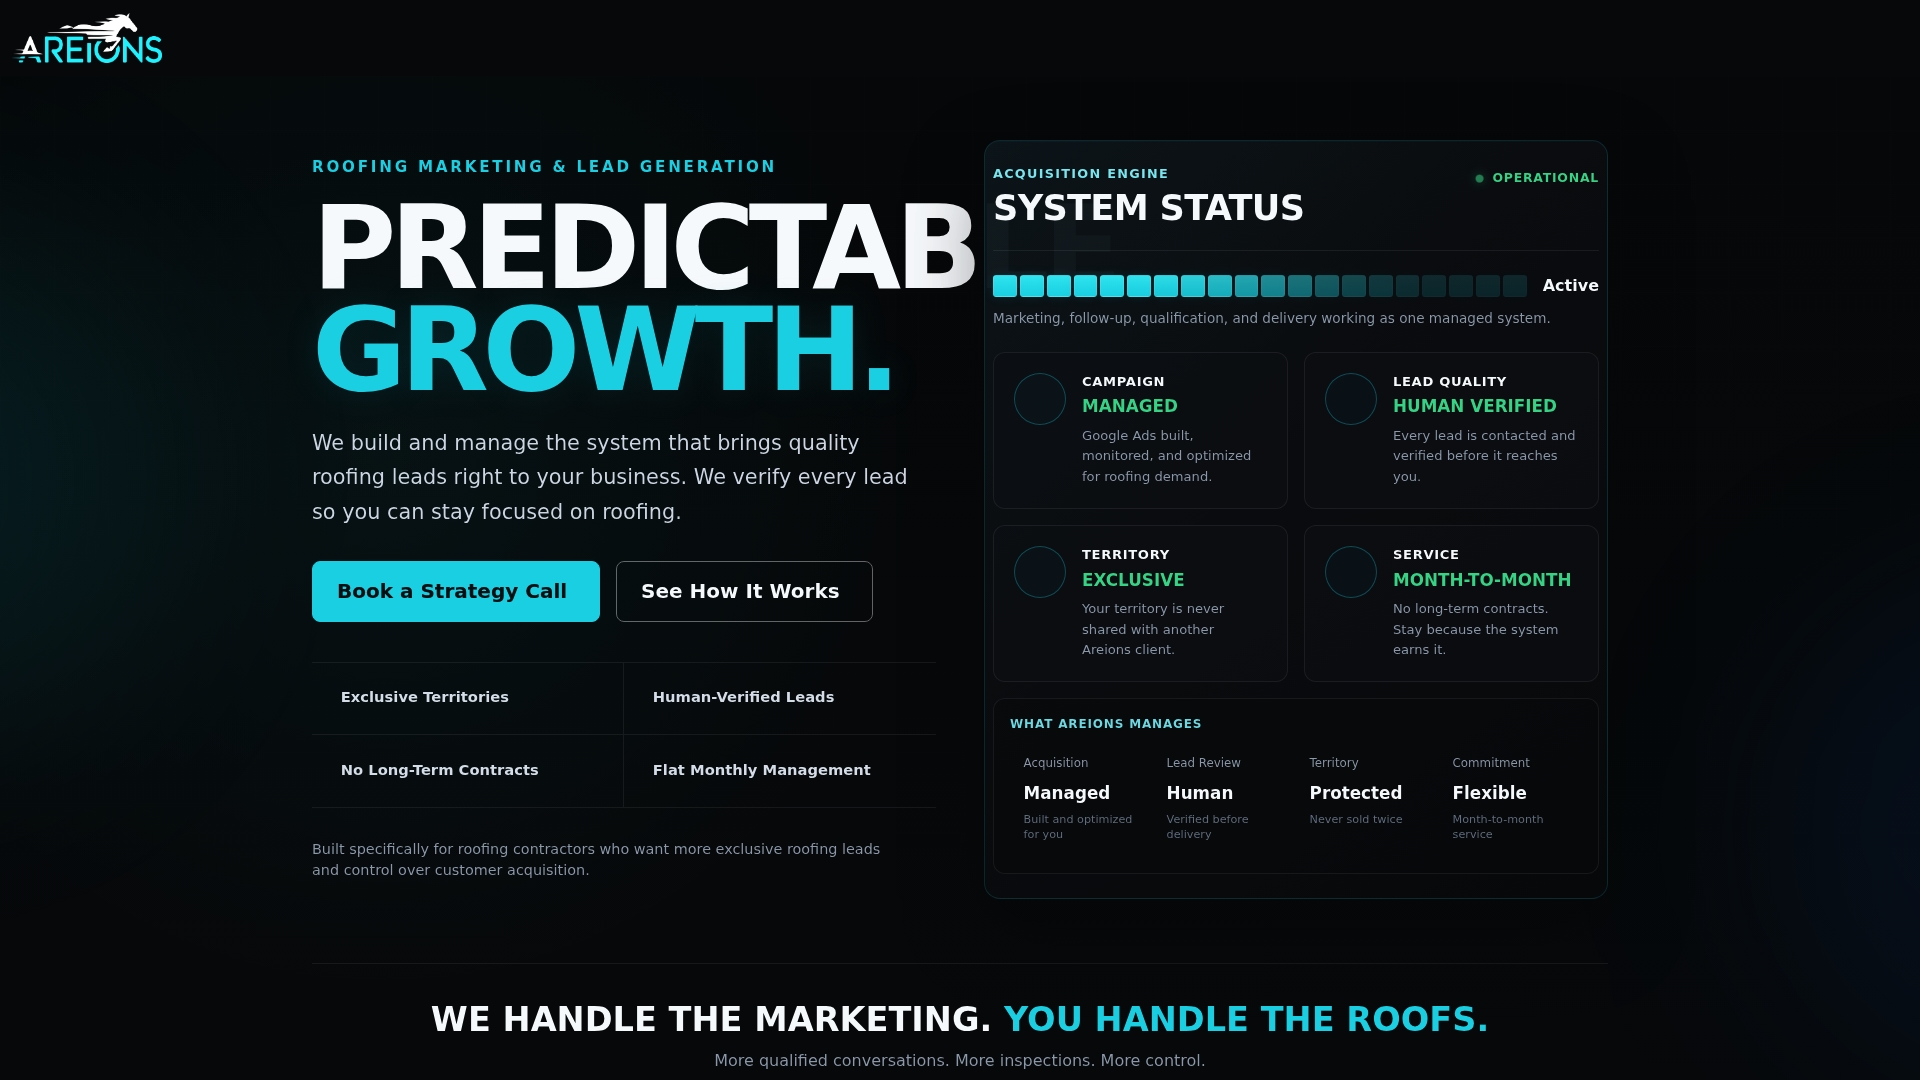
We offer flexible plans, Foundation, Professional, and Enterprise, through our Areions landing page, and territory exclusivity means you’re not competing against another client in your own service area for the same leads. If your current setup can’t answer the three questions above with real numbers, book a strategy call and we’ll walk through what a managed system would look like for your territory.
FAQ
What are the five key performance indicators in marketing?
For roofing specifically, the five to start with are cost per lead, website conversion rate, customer acquisition cost, return on ad spend, and lead-to-job conversion rate. Customer lifetime value and review conversion rate round out a fuller picture once those five are stable.
What is the 25% rule for roofing?
If you’ve heard a rule of thumb tied to margin or markup, treat it as a rough industry rule of thumb rather than a formal benchmark, and rely on the CPL, CAC, and ROAS ranges in this article for marketing-specific targets.
What are some examples of marketing KPIs?
Common marketing KPIs include cost per lead, website conversion rate, customer acquisition cost, return on ad spend, and lead-to-job conversion rate. For roofing companies, typical benchmark ranges run from $35 to $75 for CPL and 15% to 30% for lead-to-job conversion.
What are the most effective marketing strategies for roofing companies?
Strategies built around rapid response, verified storm damage leads, strong review management, and consistent local search visibility tend to outperform generic ad campaigns. Owning your Google Business Profile, Local Service Ads, and review pipeline creates more consistent lead flow than relying on any single channel.
How often should roofing companies review their marketing KPIs?
Review fast-moving numbers like cost per lead and return on ad spend weekly, since they shift quickly with campaign changes. Review customer acquisition cost and lead-to-job conversion monthly, and save customer lifetime value for a quarterly strategic review.