
Book More Signed Roofs: Storm Data and AI for Roofing Marketing
For roofing businesses, the single most important marketing metric is cost per signed job, not cost per lead. Areions built its entire model around that principle. The NOAA NCEI Storm Events Database gives you a demand baseline to judge performance against, and Google Analytics attribution shows which touchpoints actually produce revenue. The rest of this guide walks through the five measurement layers that connect marketing spend to a signed contract.
TL;DR:
- Cost per signed job should be the primary metric guiding marketing budgets, as it directly reflects campaign profitability and true economic value.
- Implementing accurate offline conversion tracking and using data-driven attribution models is crucial for linking marketing touchpoints to signed contracts.
- Incorporating storm event data from NOAA helps differentiate demand spikes caused by weather from organic campaign results, refining budget adjustments.
- Building or outsourcing a fully integrated measurement system ensures better data hygiene, identifier consistency, and reliable attribution to optimize campaign performance.
- Targeted segmentation based on property and homeowner data improves lead quality, enhances storm-response strategies, and increases average customer lifetime value.
Table of Contents
- Why cost-per-lead misleads roofing businesses and the KPI ladder you need
- Attribution and offline conversions: how to import bookable-sales data back into ad platforms
- Using storm data as a demand baseline: querying NOAA and normalizing performance
- AI and modern analytics: what to expect and how to use it for roofing ROI
- Implementation checklist: tracking, CRM mapping, verification tests, and dashboards
- How a proactive storm-response system changes measurement
- Analyzing customer demographics and segmentation for targeted roofing marketing
- Benchmarking against industry standards and competitors’ marketing performance
- Integrating multi-channel marketing data for comprehensive analytics
- Measuring customer lifetime value and retention impact from marketing efforts
- In-house analytics vs managed systems: practical trade-offs for roofers
- Areions: a managed storm-response alternative
- Sources
- FAQ
Why cost-per-lead misleads roofing businesses and the KPI ladder you need
Cost per lead tells you how cheaply you filled a form. It says nothing about whether that person ever signed a contract, and for a roofing company, that gap is where budgets get wasted. A campaign with a low CPL but a poor inspection-to-contract rate can cost far more per signed roof than a campaign with a higher CPL and better lead quality.
The KPI ladder that actually connects to revenue looks like this:
- Cost per lead: the entry-level metric, useful only as a filter, never as a decision driver.
- Cost per booked inspection: how many raw leads convert to a scheduled appointment.
- Inspection-to-contract rate: the percentage of inspections that turn into a signed job, arguably the single most telling number in the ladder.
- Average job value: what a signed contract is actually worth, since a storm-damage reroof and a minor repair are not the same economic event.
- Cost per signed job: the number that should sit at the top of every dashboard, calculated as total marketing spend divided by signed contracts.
Consider two campaigns with an identical cost per lead of $50. That is 20 signed jobs, $250 per signed job, and $180,000 in revenue. That is 8 signed jobs, $625 per signed job, and $60,000 in revenue.
Cost per signed job is the only KPI that reflects true campaign economics. Judged purely on CPL, the two campaigns look identical. Judged on signed-job economics, Campaign A is worth two and a half times more per dollar spent, a distinction that only shows up once you track a lead all the way to contract.
Once you shift budget allocation toward signed-job economics rather than lead volume, bidding strategies change too. A platform optimizing for leads will happily spend against form fills that never convert, while a platform fed job outcomes can push budget toward the audiences, keywords, and creative that historically produce signed contracts. That shift depends on getting the right data back into the ad platform, which is the subject of the next few sections.

Attribution and offline conversions: how to import bookable-sales data back into ad platforms
Attribution modeling determines how credit for a signed job gets assigned across the touchpoints that led to it. Google Analytics documentation describes several available models, including paid and organic last click and data-driven attribution, which uses account-specific data to assign fractional credit across the customer path rather than crediting a single touchpoint. For a roofing company running multiple campaigns simultaneously, data-driven attribution is generally the more useful choice, since a homeowner might click a search ad, later see a display remarketing ad, then call after a direct visit, and last-click models would credit only the final step.
Attribution model choice also affects bidding. Google Ads Help notes that switching to data-driven attribution can reveal keywords and campaigns that were undervalued under last-click reporting, which matters directly for budget allocation once you are optimizing toward signed jobs instead of leads.
Getting signed-job data back into the ad platform is what closes the loop, and the process follows a consistent sequence:
- Capture identifiers at every stage: GCLID at the ad click, form ID at submission, call session ID at first contact.
- Normalize and hash personal identifiers such as email, phone number, and address using SHA-256, a requirement for enhanced conversions for leads according to Google Ads API documentation.
- Import the conversion either through the Google Ads API for automated, ongoing imports or via CSV upload for smaller-scale or manual imports.
- Validate the match rate by checking the diagnostics Google Ads provides after each import batch, since a low match rate signals a broken identifier somewhere upstream.
Enhanced conversions for leads pair hashed user data with the original click identifier, improving match rates over GCLID alone. Google’s implementation guidance recommends batching these uploads and monitoring diagnostics closely, since incomplete or malformed identifier data is the most common reason offline conversions fail to match back to the original click.
Privacy and consent matter here too. Hashing identifiers before upload is a baseline requirement, not an optional step, and any lead data flowing into an ad platform should follow the same consent standards you apply to the rest of your marketing stack. None of this technical work matters, though, if the underlying CRM data is inconsistent, which is why identifier hygiene has to come before attribution modeling, not after.
Using storm data as a demand baseline: querying NOAA and normalizing performance
A roofing company that only measures its own marketing metrics is missing half the picture, because demand for roofing services spikes independently of anything a campaign does. The NOAA NCEI Storm Events Database tracks hail, wind, tornadoes, and other severe weather events at the county level from January 1950 through mid-2026, updated monthly, with the agency advising users to allow up to a 120-day reporting lag before treating recent data as complete.
That lag matters for how you use the data. Real-time campaign decisions during an active storm should rely on your own call volume and lead flow, while the NOAA dataset becomes most useful a few months later, when you are auditing performance and need to separate genuine marketing gains from a demand spike that would have happened regardless of ad spend.
A practical workflow looks like this: pull county-level storm events for your service area, mark the date ranges when a qualifying hail or wind event occurred, then compare lead volume and inspection-to-contract rates during those windows against a non-storm baseline period. Any lift in signed jobs during a storm window gets partially attributed to the event itself rather than credited entirely to the campaign running at the time.
- Filter by county first, since storm severity and roofing demand vary sharply even within the same state.
- Allow for the reporting lag before treating the most recent months as final.
- Compare against a rolling baseline, not a single prior month, to avoid seasonal distortion.
A simple table structure makes the comparison usable for reporting:
| Date range | County | Event type | Leads | Signed jobs | Adjustment factor |
|---|---|---|---|---|---|
| Fill in per event | Fill in per NOAA filter | Hail, wind, tornado, etc. | Actual count from CRM | Actual count from CRM | Calculated ratio vs. baseline |
Populated with your own numbers, this table becomes the backbone of a storm-adjusted performance report, showing which portion of a lead spike came from weather and which came from the campaign itself. That distinction is exactly what separates a roofing company that can defend its marketing budget with data from one that is guessing based on a good month.
AI and modern analytics: what to expect and how to use it for roofing ROI
AI tools are starting to change how roofing teams interact with their own data, mostly by removing the step where someone has to build a query or a report before getting an answer. A few features are genuinely useful in this context:
- Natural-language Q&A: asking a dashboard “what was our cost per signed job in the three counties hit by last month’s hail event” and getting a direct answer instead of building a custom report.
- Anomaly detection: flagging a sudden drop in call answer rate or a spike in lead volume without someone manually checking dashboards every day.
- Lead propensity scoring: ranking incoming leads by likelihood to convert to a signed job, based on patterns in past CRM outcomes.
During an active storm window, when call volume can multiply within hours, this kind of scoring helps a sales team prioritize the homeowners most likely to sign rather than working leads in the order they arrived. That prioritization can matter more than any single marketing decision made that week.
Pro Tip: Before trusting an AI-generated insight, check whether the underlying CRM fields it draws from (job outcome, contract value, lead source) are filled in consistently, since a model built on incomplete data will produce confident, wrong answers.
The limitation worth stating plainly: AI analytics tools are only as good as the identifiers and outcomes feeding them. A model asked to predict which leads convert needs a CRM full of labeled outcomes (signed, not signed, job value) to learn from, and a business with inconsistent data entry will get generic, unreliable answers no matter how advanced the tool. The AI layer accelerates insight generation, it does not fix a broken measurement foundation underneath it.
Implementation checklist: tracking, CRM mapping, verification tests, and dashboards
Building the full measurement pipeline is a sequence, not a single project, and skipping steps tends to surface as a mysterious gap in attribution months later.
- Audit current tracking: confirm Google Ads conversion tracking, GA4, and call tracking are all actually installed and firing correctly, not just configured once and forgotten.
- Clean up UTM hygiene: standardize a naming convention across every campaign so source, medium, and campaign name are consistent and filterable later.
- Connect call tracking to the CRM: make sure the call session ID and recording link land automatically in the lead record, not in a separate system nobody checks.
- Persist identifiers in every lead record: GCLID, form ID, and call session ID should populate automatically, never rely on a sales rep typing them in manually.
- Set up offline conversion imports: connect signed-job outcomes back to Google Ads through the API or scheduled CSV upload, hashed per the Google Ads API requirements.
- Build a dashboard anchored on cost per signed job, not cost per lead, as the primary reported number for every campaign.
Validation matters as much as setup. Run a test lead through the entire funnel, from ad click to form fill to a marked “won” status in the CRM, then confirm that conversion appears back in Google Ads within a normal reporting window. If it does not show up, the break is almost always in one of three places: a missing GCLID on the form, a hashing mismatch on the offline upload, or a CRM field that got overwritten by a manual update.
Common pitfalls worth watching for include sales reps re-entering lead information by hand and wiping out the original UTM data, call tracking numbers that get cached in a browser and misattribute repeat callers, and offline conversion imports that silently fail because of a formatting error in the hashed identifier file. Each of these is fixable, but only if someone is checking match rates and dashboard numbers on a regular schedule rather than assuming the pipeline works because it was built correctly once.
How a proactive storm-response system changes measurement
Most of the friction in roofing marketing analytics happens in the scramble after a storm hits: campaigns spun up late, landing pages built under pressure, tracking numbers assigned inconsistently. Some managed service providers build infrastructure before storms arrive, which can improve measurement accuracy and data capture. Creative, landing pages, tracking numbers, and CRM mapping are already in place when a qualifying storm event occurs, so lead capture starts clean instead of being reconstructed in real time.
That readiness shows up directly in the measurement layers described earlier: identifiers persist correctly because the systems were built and tested in advance, not assembled during a demand spike. Some managed services focus on human-verified leads tied to confirmed storm damage, which can improve inspection-to-contract rates by reducing unqualified inquiries in the funnel.
Such managed systems often deliver features like human-verified leads rather than raw form fills, territory exclusivity to avoid sharing leads among competing roofing companies in the same area, month-to-month service with no long-term contracts, and guaranteed delivery of qualified leads within a set period after starting. Each of those points maps back to a specific gap in the KPI ladder discussed earlier: verification improves the inspection-to-contract rate, exclusivity protects job value, and predictable lead delivery makes the cost-per-signed-job math easier to plan around.
Analyzing customer demographics and segmentation for targeted roofing marketing
Not every homeowner in a storm-affected county is an equally good prospect, and segmentation is how you tell the difference. Home age, roof age, property value, and homeownership status (owner-occupied versus rental) all correlate with willingness to invest in a full reroof versus a patch repair, and campaigns that ignore that distinction end up spending equally on both.
Segmenting by these factors lets you build separate messaging and even separate landing pages for, say, older homes in higher-value neighborhoods where a full reroof is more likely, versus rental properties where a landlord might only authorize a minimal repair. CRM data over time will show which segments produce the highest average job value and the best inspection-to-contract rate, and that pattern should feed directly back into targeting decisions for the next campaign.
Segmentation also sharpens the storm-adjusted baseline work described earlier, since a storm hitting an older neighborhood will produce a different signed-job rate than the same storm hitting a newer development. Treating all leads from an event as equivalent flattens out a distinction that directly affects revenue.
Benchmarking against industry standards and competitors’ marketing performance
Cost per signed job only means something in context, and that context comes from comparing your numbers against a reasonable industry range rather than judging performance in isolation. A campaign that looks expensive in a vacuum might be perfectly competitive once compared against typical inspection-to-contract rates and average job values for roofing specifically, which differ meaningfully from other home services categories.
Direct competitor data is rarely public, but you can still benchmark meaningfully by tracking your own metrics over time, by service area, and by lead source, then watching for a channel or region that consistently underperforms the rest of your own portfolio. A campaign that costs twice as much per signed job as every other channel you run is the clearest internal benchmark you have, and it does not require external data to act on.
Local visibility also factors into benchmarking, since a roofing company with a poorly maintained Google Business Profile is competing at a disadvantage before a single ad dollar gets spent. Keeping listing information accurate and reviews current, sometimes with the help of a service like Local Growth Direct, supports the same funnel that paid campaigns feed into.
Integrating multi-channel marketing data for comprehensive analytics
Roofing companies rarely run a single channel. Paid search, paid social, direct mail after a storm, and organic search each contribute leads, and none of them tell the full story in isolation. The challenge is that each channel has its own reporting interface, its own definition of a conversion, and no native way to compare cost per signed job across all of them side by side.
Bringing that data together usually means routing everything through GA4 as the central measurement layer, since it can ingest UTM-tagged traffic from any channel and pass conversion data back to Google Ads through the integrations described earlier. Channels outside the Google ecosystem, like direct mail, need a dedicated tracking number or a unique landing page URL to generate an identifier that can flow into the same CRM record as everything else.
The payoff is a single dashboard where cost per signed job is comparable across every channel, rather than five separate reports using five different definitions of success. Without that integration, budget decisions end up based on whichever channel has the easiest reporting interface, not the one actually producing the most signed jobs.
Measuring customer lifetime value and retention impact from marketing efforts
A signed roof is not always a one-time transaction. Roofing companies that also handle gutter work, maintenance plans, or storm damage on other structures on the same property have a retention angle that pure lead-gen metrics miss entirely, since cost per signed job only captures the value of the first contract.
Tracking customer lifetime value means keeping a CRM record open past the initial job completion, logging any follow-up work, referrals, or repeat storm-related jobs tied to the same homeowner over time. A customer who generates a second job or refers a neighbor changes the real return on the marketing spend that acquired them in the first place, even though that value shows up months or years after the original campaign ended.
For a roofing company weighing which lead sources to keep investing in, a channel that produces slightly more expensive signed jobs but a meaningfully higher rate of repeat business or referrals may be worth more than a cheaper channel with one-and-done customers. That comparison only becomes visible if lifetime value gets tracked as its own metric, separate from the cost-per-signed-job number used for immediate campaign decisions.
In-house analytics vs managed systems: practical trade-offs for roofers
Building this measurement pipeline in-house gives you full control over the data and no recurring management fee, but it demands consistent technical maintenance: someone has to keep tracking tags current, watch match rates on offline conversion imports, and enforce CRM data hygiene every single week. Outsourcing that work costs more per month but trades ongoing maintenance burden for speed and completeness, since a managed provider has already built and tested the pipeline across other roofing accounts.
A few signals tend to indicate outsourcing makes sense:
- Inconsistent CRM data entry, where sales reps skip fields or overwrite identifiers during manual updates.
- No dedicated staff member responsible for checking conversion match rates or campaign attribution on a regular schedule.
- Identifier capture gaps, where GCLIDs or call session IDs are missing from a meaningful share of lead records.
A staged approach often works better than an all-or-nothing decision. Keep dashboard reporting and basic UTM hygiene in-house, since those require more oversight than technical skill, while outsourcing the higher-friction pieces, like offline conversion imports and call-tracking integration, to a provider who maintains that infrastructure across many accounts and has already worked through the common failure points.
Areions: a managed storm-response alternative
If building and maintaining this pipeline in-house is not a good use of your team’s time, Some providers offer managed versions of this service that handle Google Ads campaigns, landing page creation, CRM and pipeline setup, and automated lead routing, designed around a storm-response model as described earlier.
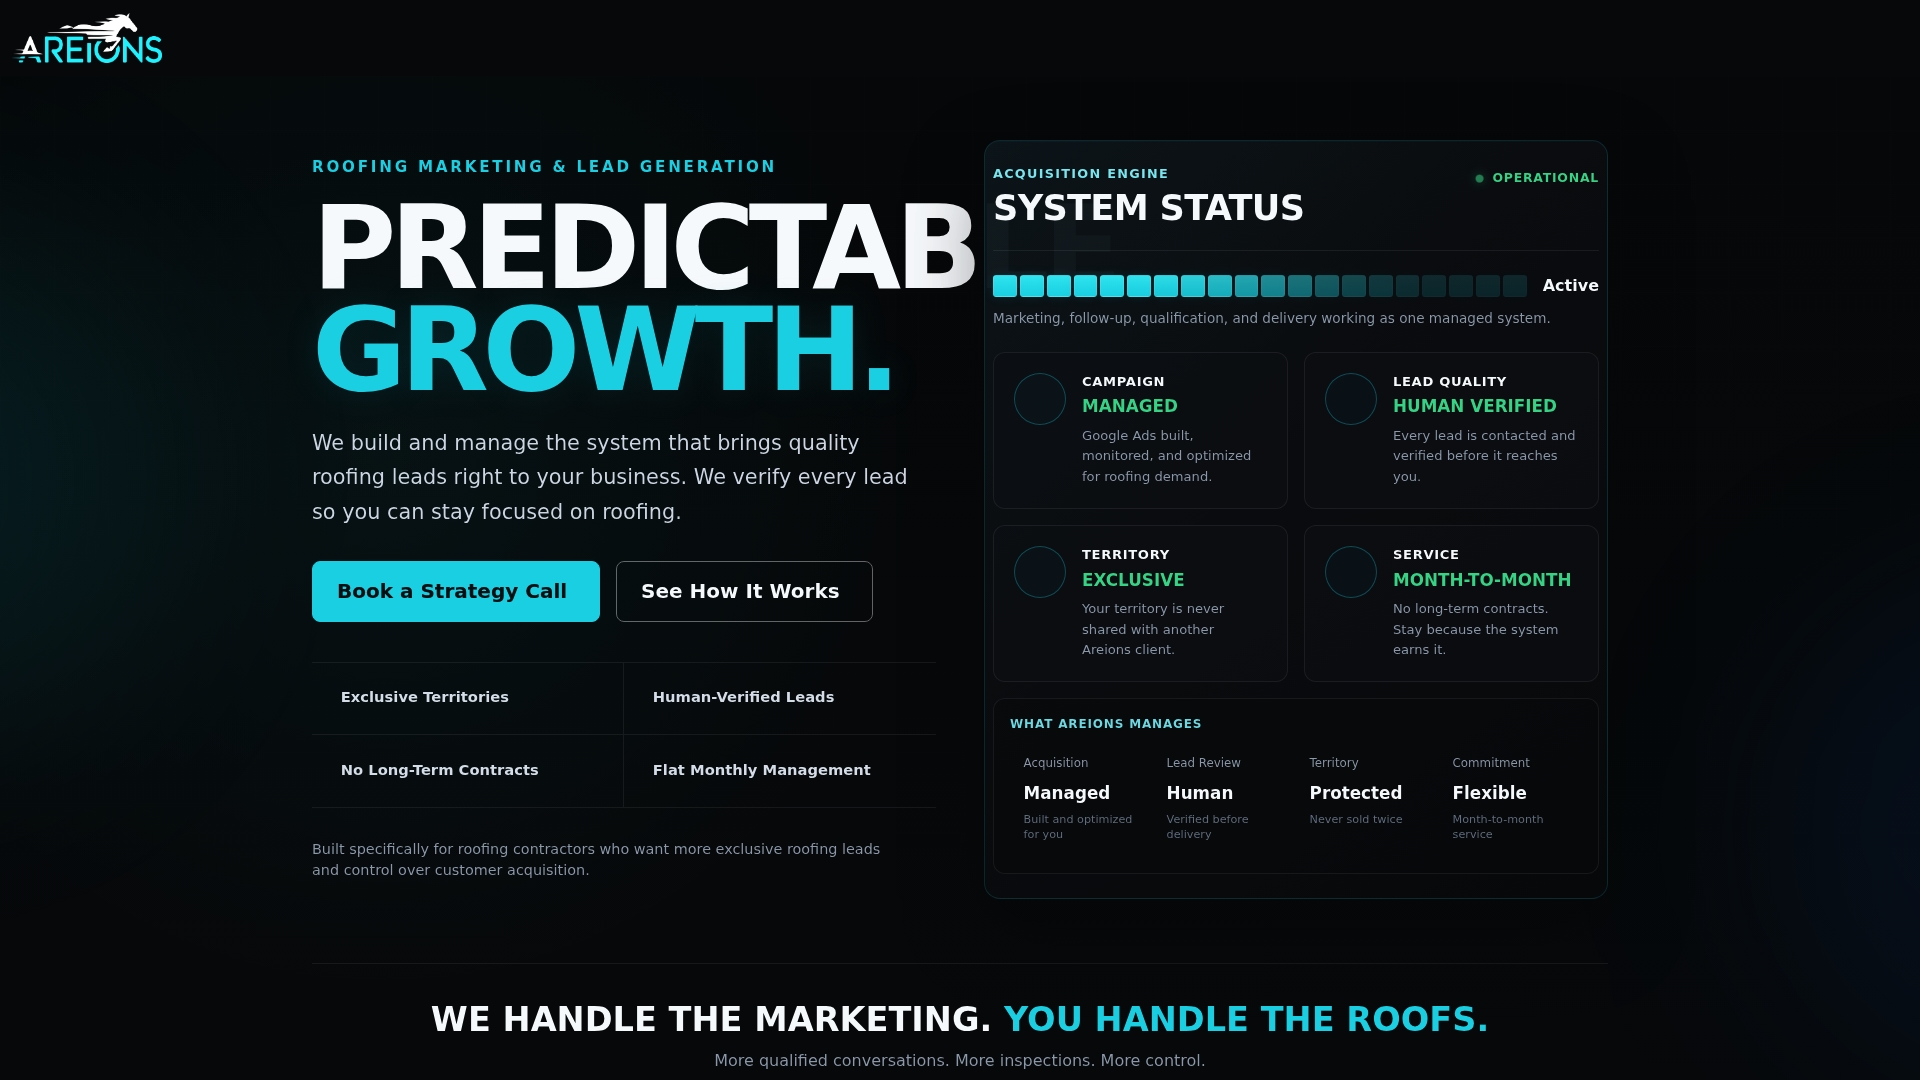
What that looks like in practice:
- Human-verified leads tied to confirmed storm damage, reducing unqualified inquiries in the funnel.
- Territory exclusivity, so leads are not shared with competing roofing companies in your service area.
- CRM integration and call verification built in, addressing the identifier-hygiene work covered earlier in this guide.
- Month-to-month plans with no long-term contract, and qualified leads guaranteed within 30 days of starting.
This is one route among several, suited to roofing teams that would rather have the storm-response and measurement infrastructure built and managed for them than assemble it themselves. If that fits where your business is right now, you can book a strategy call to walk through your service area and current setup, or visit Areions to see the Foundation, Professional, and Enterprise plans.
Sources
- NCEI Storm Events Database (Storm events web access)
- Get started with attribution - Analytics Help
- Upload offline conversions - Google Ads API docs
FAQ
What is the best marketing for a roofing company?
There is no single best channel, but the marketing that performs best is whatever produces the lowest cost per signed job, not the lowest cost per lead. Storm-triggered paid search and direct outreach tend to perform well for roofing specifically because they intercept active demand rather than trying to create it.
What are the four main types of marketing analytics?
Marketing analytics is commonly grouped into descriptive (what happened), diagnostic (why it happened), predictive (what is likely to happen next), and prescriptive (what action to take). For roofing specifically, these map to reviewing past campaign performance, identifying why a campaign underperformed, forecasting demand around storm season, and deciding where to shift budget next.
What are the current trends in the roofing market?
Storm-driven demand modeling and AI-assisted analytics are becoming more common as roofing companies look to separate genuine marketing performance from weather-driven demand spikes. Offline conversion imports and enhanced conversions for leads are also seeing wider adoption as more contractors connect CRM outcomes back to ad platforms.
Why do roof salesmen make so much?
Roofing sales commissions tend to be high because average job values are large, often several thousand dollars per contract, and a single signed roof can represent a meaningful chunk of total revenue for a small crew. Commission structures reward closing high-value jobs rather than generating volume, which is part of why inspection-to-contract rate matters so much to overall profitability.
— Angel